
Data Foundations for Manufacturing Reporting: Structure Before Scale
Data foundations for manufacturing reporting are critical for the success of the reporting initiative. In effect, manufacturing reporting rarely fails because a chart is unattractive. It fails because the numbers underneath the charts disagree. A shop floor already produces measurements, and those measurements tend to sleep in systems that do not talk to each other. Machines hold cycle data, quality holds inspection results, and the ERP holds orders, costs, and inventory. The job of a data foundation is to bring those sources into one place with one definition per indicator that production and management both accept. Structure comes first. Scale comes second.
The symptom looks like a dashboard, but the cause is structural
Most requests for better reporting arrive as a visual problem. An operations leader wants a cleaner view of output, scrap, or schedule adherence. A plant manager wants a weekly pack that does not require three analysts and a spreadsheet merge. Underneath those requests sits a repeatable pattern: the reporting layer is being asked to compensate for missing structure.
A useful illustration comes from the enterprise software world. A manufacturer upgrading from work order to production management discovered that its custom reports needed rework because they were built against tables that were about to change. Reports had been written directly against a transactional structure rather than against a stable layer designed for reporting. When the operational system moved, the reports moved with it, whether anyone wanted that or not.
That is the structural failure in miniature. When reports depend on the shape of source tables, every system change becomes a reporting project.
What the team sees | What is usually missing |
|---|---|
Two reports, two different output totals | A single definition per indicator, shared by production and management |
Monthly close takes days of manual reconciliation | A managed monthly reporting cycle with defined steps |
Reports break after an ERP upgrade | A reporting layer decoupled from source table structures |
Machine data lives in a separate world from finance | Ingestion that reaches legacy controllers and modern protocols alike |
Nobody trusts the numbers enough to act | Documented ownership of definitions and refresh logic |
Four structural layers of data foundations for manufacturing reporting
A foundation is not one tool. It is a sequence of layers, each of which has to hold before the next one can be trusted. Manufacturers that skip a layer tend to rebuild the layers above it repeatedly.
Layer one: source capture across machines, quality, and the ERP
The first layer is collection. Data warehousing practice typically describes this as extracting from databases, CRM, ERP, APIs, and files, then transforming what was collected into a usable form. Manufacturing adds a physical dimension to that list. The sources include equipment on the floor, inspection and quality records, and the enterprise system that holds commercial reality.
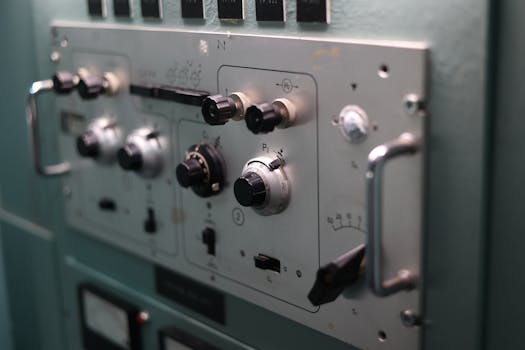
The practical difficulty is generational. A plant data platform has to speak to every machine generation, modern protocols and legacy controllers alike. Older equipment may expose data through an interface that predates any modern standard, while newer assets publish through current ones. A foundation that only handles the new equipment leaves part of the floor invisible, and partial visibility produces partial decisions.
Layer two: one definition per indicator
This is the layer that decides whether reporting becomes a decision system or a debate club. The goal is a single definition per indicator, agreed by production and management, and stored somewhere that every report reads from. One definition of throughput. One definition of downtime. One definition of scrap. One definition of schedule adherence.
Definitions are not just formulas. They include the grain of the data, the time window, the treatment of partial shifts, and the handling of rework. When those choices are written down and enforced in a shared model, arguments about whose number is correct disappear. What remains is the more useful argument about what the number means for the next shift.
Layer three: the reporting calendar and refresh discipline
Manufacturing reporting runs on a cycle. The steps of the monthly reporting cycle need to be managed the same way a production schedule is managed: with named owners, defined sequence, and a known point at which the numbers are frozen. Daily operational views and monthly management views have different rhythms. Mixing them creates confusion about which figures are final.
A published calendar solves more disputes than most technical fixes. When everyone knows that the production figures lock at a specific stage of the cycle, the conversation shifts from reconciliation to action.
Layer four: governance that survives system upgrades
Governance is the layer that keeps the foundation standing after the original team moves on or the ERP gets replaced. In practice that means documented definitions, documented lineage, and a rule that reports read from the reporting layer rather than from raw transactional tables.
A case study from the insurance sector shows the shape of this at enterprise scale: a governed data hub, API-led interoperability, and an architecture designed for AI from the start, built by rationalizing decades of legacy systems. Manufacturing does not need the same scale, but the principle transfers. The governed layer is what makes downstream reporting stable.
Structure before scale: the build order that works
Scaling reporting before structure exists produces more dashboards reading from more inconsistent sources. The sequence below reverses that pattern.
Inventory the sources. List every machine family, quality system, and ERP module that feeds reporting, and note which ones publish through modern protocols and which need an adapter.
Define the indicator set. Agree the small number of measures that production and management will both use. Write each definition down in plain language before writing any code.
Build the integration layer. Bring machines, quality checks, and the ERP into one place, with transformation handled in a repeatable pipeline rather than in individual reports.
Model once, publish many. Create a reporting model that reports read from, so a change in a source system does not become a rebuild of every visual.
Publish the calendar. Define the reporting cycle and the freeze points for daily, weekly, and monthly views.
Scale the visual layer. Add dashboards only after the layers beneath them hold.
Notice how late the dashboards appear in that list. Bringing measurements together in one place with shared definitions is often worth more than any model laid on top, because the model is only as good as the definitions feeding it.
Legacy equipment and the maintenance question
Once machine data flows reliably, the same foundation supports maintenance driven by measured condition rather than by fixed intervals. That shift depends entirely on data continuity: vibration, temperature, cycle counts, and fault codes need to arrive consistently enough to establish a baseline. The foundation is what makes condition-based maintenance possible. Without it, the maintenance team is guessing with extra steps.
Designing for AI without starting with AI
Manufacturing interest in AI-based knowledge graphs and similar techniques keeps growing. Research continues into how those structures support intelligent systems. The sequencing matters. A knowledge graph, a predictive model, or an anomaly detector all inherit the quality of the layer beneath them. If one definition per indicator does not exist, an AI layer will surface the disagreement faster and with more confidence. This is evidently worse than not having it.
Architectures designed for AI from the start share one trait: the governed data layer arrives first, and intelligence is layered on top of it. The foundation is the prerequisite, not the follow-up project.

How ERAM frames the sequence
Eden Data Studio's Eden Reporting Architecture Method treats reporting as a structural decision system rather than a collection of dashboards. In manufacturing terms, an ERAM-style audit asks whether the four layers exist, scores the architecture, and produces an implementation roadmap that starts where the foundation is weakest. Teams that begin with the scorecard usually discover that their dashboard backlog is really a definition backlog. Fixing the definitions first makes the backlog smaller and the dashboards cheaper to build.
Frequently Asked Questions
What are data foundations for manufacturing reporting?
This is referring to the layer beneath the dashboards: collection from machines, quality systems, and the ERP; transformation into a common structure; one agreed definition per indicator; and governance that documents who owns each definition. Reports read from this layer rather than from raw source tables. When it exists, system upgrades change the foundation in one place instead of breaking every report individually.
How many definitions should a single indicator have?
One, shared by production and management. Multiple definitions of the same measure are the most common reason two reports disagree. The work is not only writing a formula but agreeing on grain, time windows, treatment of partial shifts, and rework handling. Document the decision, store it in the reporting model, and let every report inherit it.
Should we build dashboards before the data model?
Building dashboards first usually guarantees rework. Reports written directly against transactional tables break whenever those tables change. This is exactly what happened to a manufacturer moving from work order to production management and discovering custom reports needed rewriting. Model the data, define the indicators, then publish visuals on top of a stable layer.
How do we handle legacy machines that lack modern interfaces?
A plant data platform is expected to speak to every machine generation, modern protocols and legacy controllers alike. In practice that means adapting older signals into the same pipeline that carries newer data. Consequently, the reporting layer sees one consistent stream. Verify available interfaces and supported protocols with your equipment vendor or integrator before committing to a collection design.
Does better reporting require AI?
No. AI adds value after the foundation holds, not before. Anomaly detection, condition-based maintenance models, and knowledge graph approaches all depend on consistent, well-defined inputs. If definitions disagree today, an AI layer will surface that disagreement faster and with more confidence. Fix collection, definitions, and governance first, then decide whether intelligence is genuinely needed.
