Designing Manufacturing Dashboards for Managers
A manufacturing dashboard is a real-time visual system that consolidates production, quality, maintenance, and supply-chain data into a single interactive view. That is the definition on paper. In practice, manufacturing dashboards fall into two groups: screens built to impress during a quarterly review, and screens a plant manager opens at the start of a shift because the numbers answer a question they already have. Designing for the second group is the entire job, and it starts well before any visual is dragged onto a canvas.
Who the Dashboard Is Actually For
Manufacturing dashboards are real-time visual interfaces that provide critical production data for operators, supervisors, and executives. Those three audiences share a factory but not a time horizon. An operator needs to know whether the machine in front of them is running, drifting, or stopped. A supervisor needs the line and the shift. An executive needs trend, exception, and comparison across plants or periods.
One screen cannot serve all three at the same depth, and attempts to do so usually end up serving none of them. The data source can be identical. The grain, the filtering, and the time window cannot. Decide which audience owns the primary view before design work begins, then decide whether the other audiences get a second page, a drill-through, or nothing at all.
The Three Types of Manufacturing Dashboards
There are three primary types of dashboards in manufacturing: production, supply chain, and quality control. Each answers a different question, and each tends to live with a different group of people.
Dashboard type | Question it answers | Typical focus |
|---|---|---|
Production | Are we running to plan right now? | Output, OEE, cycle time, downtime across machines, lines, and shifts |
Quality control | Is what we are making meeting specification? | Defect rates and quality performance tied to production runs |
Supply chain | Will the line have what it needs? | Material and supplier flow feeding production |
Most plants need all three eventually. Few need all three on day one. Production almost always comes first because it sits closest to the daily rhythm of the floor, and because the operational data it depends on is usually the data that already exists in some usable form.
Start With Decisions, Not With Visuals
Manufacturing dashboards play a central role in how modern factories monitor performance, respond to issues, and make informed decisions. That sentence describes an outcome, not a layout. The layout is downstream of it. Before choosing a chart type, write down the decisions the dashboard is supposed to support: which decisions, made by whom, at what frequency, and with what current alternative.
If a number never triggers an action, it is decoration. If a number triggers an action but arrives two days late, the dashboard is a report, not an operational tool. Manufacturing dashboards reduce decision latency, highlight bottlenecks, and enable continuous improvement across the factory floor, but only when the information shown is tied to something a person can still change. A bottleneck identified in the current shift can be addressed. The same bottleneck identified next week is a history lesson.
Choose KPIs That Fit on One Screen
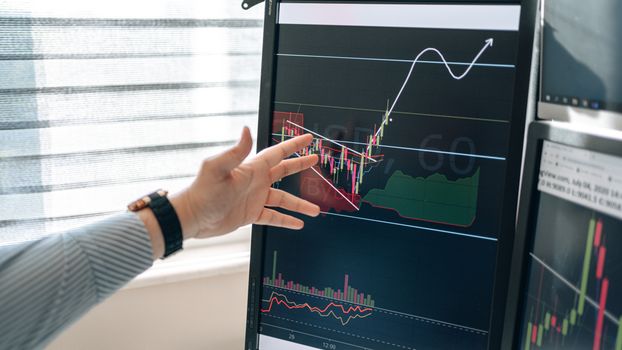
Manufacturing dashboards monitor OEE, defect rates, cycle time, downtime, and other critical KPIs across machines, lines, and shifts. That list is a starting menu, not a checklist. Putting all of it on the first screen is the most common failure pattern in dashboard design.
OEE (overall equipment effectiveness) shows how much of the available time equipment was actually productive.
Defect rates connect production output to quality outcomes.
Cycle time reveals pace and variation against the expected rate.
Downtime explains where capacity disappeared.
Calibration status keeps measurement equipment trustworthy, which keeps every other number trustworthy.
A practical rule: the top of the screen gets the numbers that change the day, the middle gets the trends that explain them, and the bottom gets the detail someone can act on immediately. If a metric only supports a monthly conversation, it belongs in a different view.
Design for Reading at a Glance
Real-time manufacturing dashboards provide a visual representation of processes and production so teams can monitor KPIs in one central place. A single central place is only useful if it can be read quickly under imperfect conditions: on a shop floor monitor, from a distance, in the middle of a shift handover.
A digital manufacturing dashboard is one of the most effective tools for production optimization because better information leads to better decisions, and a real-time display of the highest priority information means decisions can be made well and quickly. Speed is a design constraint. It has implications for font size, contrast, color use, and how much text is allowed on the screen. It also means the most important number should be unmistakable without hovering, clicking, or filtering.
Cards, Graphs, and Tables Each Have a Job
Manufacturing dashboards combine data cards, graphs, tables, and other visualization techniques to make production KPIs easy to understand. Each element type carries information differently, and mismatching them creates confusion.
Data cards are for single current values that need to be seen instantly. Graphs are for movement over time, comparison across lines, and spotting patterns that a single number hides. Tables are for detail: the specific machine, the specific work order, the specific shift where something went wrong. When a table is doing the job of a card, the screen is too slow. When a card is doing the job of a table, the screen is too vague.
Build the Data Foundation Before the First Visual
A dashboard that consolidates production, quality, maintenance, and supply-chain data into a single interactive view is really a data model with a face on it. This is where most projects quietly fail. Two systems define downtime differently. One records shift boundaries at a different hour. A metric name means one thing on the production report and something else in the ERP extract.
Eden Data Studio approaches this through ERAM, a reporting architecture method that treats reporting as a structural decision system rather than a collection of dashboards. In practice, that means definitions, grain, and ownership get settled before layout, so the visual layer sits on top of something stable. For plants working in Power BI, the same principle applies to the semantic model: clean relationships, agreed measures, and one definition per metric rather than three competing ones.
A Practical Build Sequence
Name the primary audience and the decisions they need to make.
List the KPIs that support those decisions, in priority order.
Confirm the source, grain, refresh frequency, and definition for each KPI with the people who own the data.
Sketch the layout on paper with the top three numbers placed first.
Build the semantic layer before building visuals.
Test on the screen the dashboard will actually be viewed on, not just on a developer monitor.
Mistakes That Undo Good Design
Mixing operator, supervisor, and executive needs on one page with no clear hierarchy.
Loading the first screen with every available metric instead of the ones tied to action.
Leaving KPI definitions undocumented, so arguments about the number replace decisions about the line.
Treating the launch as the end of the project rather than the start of maintenance.
Building for visual polish before the underlying data model is trustworthy.
Screens that survive in daily use tend to be the least crowded ones. They earn their place because someone changed something on the floor because of what they saw.
Frequently Asked Questions
What are manufacturing dashboards?
A manufacturing dashboard is a real-time visual system that consolidates production, quality, maintenance, and supply-chain data into a single interactive view. It helps operations teams monitor OEE, defect rates, cycle time, downtime, and other critical KPIs across machines, lines, and shifts, and it gives operators, supervisors, and executives one shared reference point instead of several disconnected reports.
What are the main types of manufacturing dashboards?
There are three primary types: production, supply chain, and quality control. Production dashboards track output and equipment performance, quality control dashboards track conformance and defect rates, and supply chain dashboards track the material and supplier flow feeding the line. Many plants start with production because it aligns most closely with the daily rhythm of the floor.
How many KPIs should appear on a manufacturing dashboard?
Fewer than most teams assume. The first screen should carry the numbers that change the current shift, supported by trends that explain them and detail that can be acted on. Manufacturing dashboards commonly monitor OEE, defect rates, cycle time, downtime, and calibration, but showing all of them at once often slows reading rather than speeding up decisions.
Do manufacturing dashboards need to be real-time?
It depends on the decision the screen supports. A dashboard that helps someone respond to a bottleneck mid-shift needs current data, because reducing decision latency is the point. A view used for weekly planning or supplier review can run on a slower refresh without losing value. Match the refresh rate to the decision, not to the technology.
Who should be involved in designing the dashboard?
The people who will use it and the people who own the underlying data. Operators, supervisors, and managers each see different parts of the process, and disagreements about KPI definitions usually surface during design if the right people are in the room. Bringing data owners in early prevents the metric conflicts that make a finished dashboard untrustworthy.
